这是知乎上的一个问题(www.zhihu.com/question/61…
我随手写了几句,转到此处。
结论是不会
计算器和计算机淘汰了算盘,催生了新的职业,掌握新技能的人淘汰了默守陈规的人。

被淘汰的是没有跟随技术发展的人。
人工智能的发展,只会让程序员的日子越来越好过,而不是被淘汰。
首先这会引领大批的程序员投身人工智能领域,人力朝着更能促进生产力发展的方向去流动是社会进步的表现。
其次,人工智能会改变传统的工具链,生态,产品形态,程序员的工作方式,会让程序员以更加高效、智能、高质量的方式去工作。
所以我们不用担心是否被淘汰,而是要保持好奇心,保持进取心。大部分人不能引领潮流,但是至少不要被潮流丢弃。
举个例子
举一个和我工作比较相关的例子,我每天都在和各种各样的图表打交道,我们使用图表的方式是根据需求,定制各种配置。以最近开源的 VisActor 为例,如果我们想使用图表库或者表格组件库我们要做什么呢?
传统流程
-
查看demo
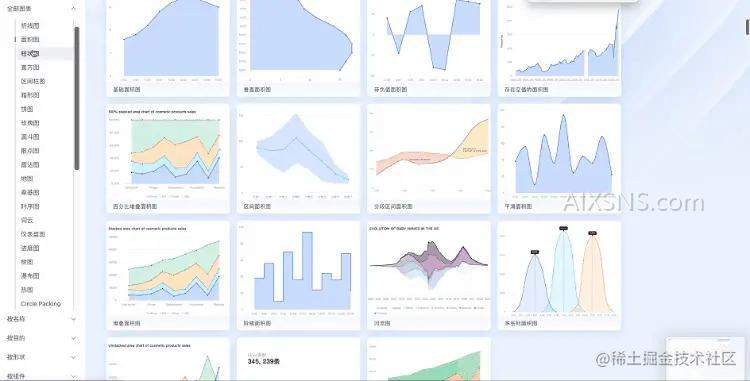
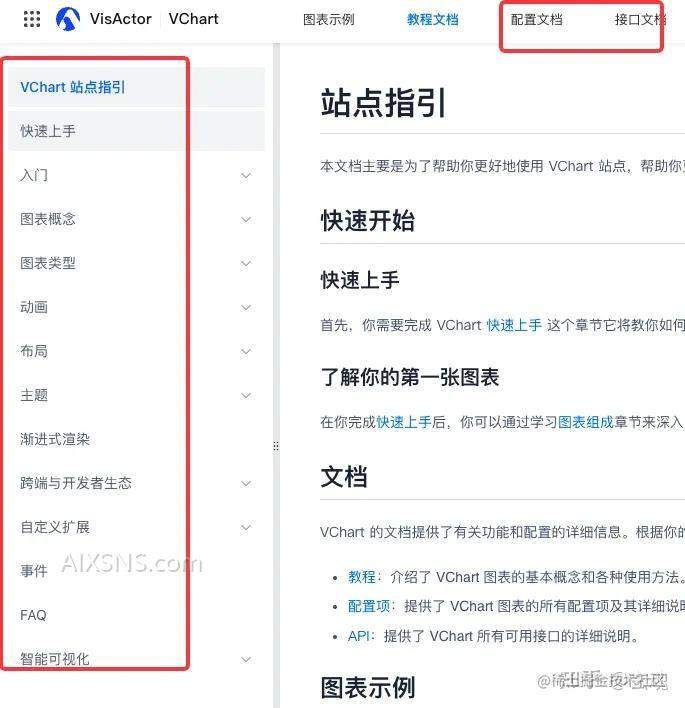
- 查看各种文档

- 上手测试
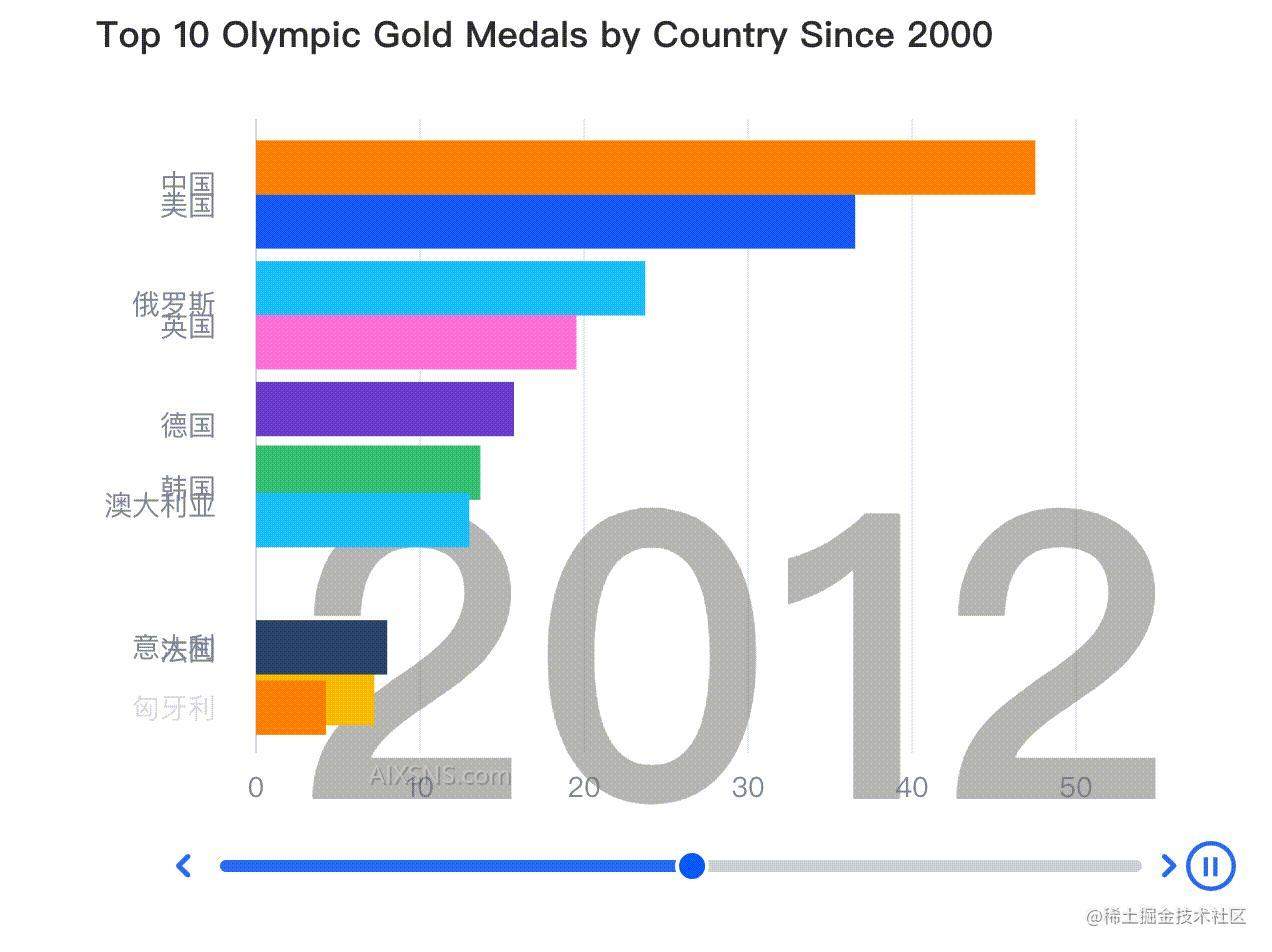
熟悉图表的各种配置,对照文档来学习(demo 来自 www.visactor.io/vchart/demo…)。
const goldenMedals = {
  2000: [
    { country: 'USA', value: 37 },
    { country: 'Russia', value: 32 },
    { country: 'China', value: 28 },
    { country: 'Australia', value: 16 },
    { country: 'Germany', value: 13 },
    { country: 'France', value: 13 },
    { country: 'Italy', value: 13 },
    { country: 'Netherlands', value: 12 },
    { country: 'Cuba', value: 11 },
    { country: 'U.K.', value: 11 }
  ],
  2004: [
    { country: 'USA', value: 36 },
    { country: 'China', value: 32 },
    { country: 'Russia', value: 28 },
    { country: 'Australia', value: 17 },
    { country: 'Japan', value: 16 },
    { country: 'Germany', value: 13 },
    { country: 'France', value: 11 },
    { country: 'Italy', value: 10 },
    { country: 'South Korea', value: 9 },
    { country: 'U.K.', value: 9 }
  ],
  2008: [
    { country: 'China', value: 48 },
    { country: 'USA', value: 36 },
    { country: 'Russia', value: 24 },
    { country: 'U.K.', value: 19 },
    { country: 'Germany', value: 16 },
    { country: 'Australia', value: 14 },
    { country: 'South Korea', value: 13 },
    { country: 'Japan', value: 9 },
    { country: 'Italy', value: 8 },
    { country: 'France', value: 7 }
  ],
  2012: [
    { country: 'USA', value: 46 },
    { country: 'China', value: 39 },
    { country: 'U.K.', value: 29 },
    { country: 'Russia', value: 19 },
    { country: 'South Korea', value: 13 },
    { country: 'Germany', value: 11 },
    { country: 'France', value: 11 },
    { country: 'Australia', value: 8 },
    { country: 'Italy', value: 8 },
    { country: 'Hungary', value: 8 }
  ],
  2016: [
    { country: 'USA', value: 46 },
    { country: 'U.K.', value: 27 },
    { country: 'China', value: 26 },
    { country: 'Russia', value: 19 },
    { country: 'Germany', value: 17 },
    { country: 'Japan', value: 12 },
    { country: 'France', value: 10 },
    { country: 'South Korea', value: 9 },
    { country: 'Italy', value: 8 },
    { country: 'Australia', value: 8 }
  ],
  2020: [
    { country: 'USA', value: 39 },
    { country: 'China', value: 38 },
    { country: 'Japan', value: 27 },
    { country: 'U.K.', value: 22 },
    { country: 'Russian Olympic Committee', value: 20 },
    { country: 'Australia', value: 17 },
    { country: 'Netherlands', value: 10 },
    { country: 'France', value: 10 },
    { country: 'Germany', value: 10 },
    { country: 'Italy', value: 10 }
  ]
};

const dataSpecs = Object.keys(goldenMedals).map(year => {
  return {
    data: [
      {
        id: 'id',
        values: goldenMedals[year].sort((a, b) => b.value - a.value)
      },
      {
        id: 'year',
        values: [{ year }]
      }
    ]
  };
});
const duration = 2000;
const spec = {
  type: 'bar',
  padding: {
    top: 12,
    right: 100,
    bottom: 12
  },
  data: dataSpecs[0].data,
  direction: 'horizontal',
  yField: 'country',
  xField: 'value',
  seriesField: 'country',
  axes: [
    {
      animation: true,
      orient: 'bottom',
      type: 'linear',
      visible: true,
      grid: {
        visible: true
      }
    },
    {
      animation: true,
      id: 'axis-left',
      orient: 'left',
      width: 130,
      tick: { visible: false },
      label: { visible: true },
      type: 'band'
    }
  ],
  title: {
    visible: true,
    text: 'Top 10 Olympic Gold Medals by Country Since 2000'
  },
  animationUpdate: {
    bar: [
      {
        type: 'update',
        options: { excludeChannels: ['x', 'y'] },
        duration
      },
      {
        channel: ['x', 'y'],
        options: { excludeChannels: ['width'] },
        duration: 500
      }
    ],
    axis: {
      duration: 500,
      easing: 'linear'
    }
  },
  customMark: [
    {
      type: 'text',
      dataId: 'year',
      style: {
        textBaseline: 'bottom',
        fontSize: 200,
        textAlign: 'right',
        fontFamily: 'PingFang SC',
        fontWeight: 600,
        text: datum => datum.year,
        x: () => {
          return vchart.getChart().getCanvasRect()?.width - 50;
        },
        y: () => {
          return vchart.getChart().getCanvasRect()?.height - 50;
        },
        fill: 'grey',
        fillOpacity: 0.5
      }
    }
  ],
  player: {
    type: 'continuous',
    orient: 'bottom',
    auto: true,
    loop: true,
    dx: 80,
    position: 'middle',
    interval: duration,
    specs: dataSpecs,
    slider: {
      railStyle: {
        height: 6
      }
    },
    controller: {
      backward: {
        style: {
          size: 12
        }
      },
      forward: {
        style: {
          size: 12
        }
      },
      start: {
        order: 1,
        position: 'end'
      }
    }
  }
};

const vchart = new VChart(spec, { dom: CONTAINER_ID });
vchart.renderAsync();

// Just for the convenience of console debugging, DO NOT COPY!
window['vchart'] = vchart;
- 应用到项目中
根据实际的项目需求定制功能。
是不是可以更智能一点呢?
我们做了这些基础研发之后,觉得如果和人工智能结合,图表的应用流程可以有更简便的方式,也许用户只需要告诉我们他们想要什么就可以了。我们设想了一个初级的原型:

例如,我们想使用下面的商品销售额数据,展示不同区域各商品销售额:
| 商品名称 | region | 销售额 |
|---|---|---|
| 可乐 | south | 2350 |
| 可乐 | east | 1027 |
| 可乐 | west | 1027 |
| 可乐 | north | 1027 |
| 雪碧 | south | 215 |
| 雪碧 | east | 654 |
| 雪碧 | west | 159 |
| 雪碧 | north | 28 |
| 芬达 | south | 345 |
| 芬达 | east | 654 |
| 芬达 | west | 2100 |
| 芬达 | north | 1679 |
| 醒目 | south | 1476 |
| 醒目 | east | 830 |
| 醒目 | west | 532 |
| 醒目 | north | 498 |
使用以下代码,获得图表spec:
const csvData=`商品名称,region,销售额
可乐,south,2350
可乐,east,1027
可乐,west,1027
可乐,north,1027
雪碧,south,215
雪碧,east,654
雪碧,west,159
雪碧,north,28
芬达,south,345
芬达,east,654
芬达,west,2100
芬达,north,1679
醒目,south,1476
醒目,east,830
醒目,west,532
醒目,north,498`
const describe='帮我展示不同区域各商品销售额'
const { spec, time } = await (vmind.generateChart(csvData, describe)); //图表智能生成,传入您的csv格式的数据和图表描述,返回图表spec和图表动画时长
接下来,我们就可以使用VChart绘制生成的图表。 在绘图前我们需要为 VChart 准备一个具备高宽的 DOM 容器。
<body>
  <!-- 为 vchart 准备一个具备大小(宽高)的 DOM,当然你也可以在 spec 配置中指定 -->
  <div id="chart" style="width: 600px;height:400px;"></div>
</body>
接下来,我们创建一个VChart实例,传入刚刚生成的spec和 DOM 容器的 ID:
// 创建 vchart 实例
const vchart = new VChart(spec, { dom: 'chart' });
// 绘制
vchart.renderAsync();
生成的图表如下:

我们还可对图表提更多的要求,例如:
const describe='帮我展示不同区域各商品销售额,使用折线图,region做x轴'
const { spec, time } = await (vmind.generateChart(csvData, describe)); //图表智能生成,传入您的csv格式的数据和图表描述,返回图表spec和图表动画时长
生成的图表如下:
目前我们发布了可以供开发者体验的npm包,开放了有限的功能,可以通过 www.visactor.io/vchart/guid…
查看使用方法。
我们觉得这个实践很有趣,也代表了未来的发展方向。会持续投入并输出。
简单总结
作为一个可视化研发,我不会觉得人工智能会让我失业,反而会促进我们朝着更好的方向发展。
相关链接: VisActor 官网 www.visactor.io/
github: github.com/VisActor
